4 box model for deciding on the future – part 1
I regular make decisions about where I’m going to spend most of my working effort.
A few years ago, I was sharing my ideas and potential options with a few friends and ex-colleagues. I used an extension to the typical four-box models. This simplified the thinking and forced me to recognise a few major questions that I’d been skirting around.
I wasn’t short of ideas for businesses; some proven, some not. But I recognised I didn’t have enough time to do everything, nor enough available funding to pay others to do everything. Importantly, I didn’t have sufficient time or energy to chase funding to make all the ideas happen (and chasing too many would disqualify the ideas from most potential funders).
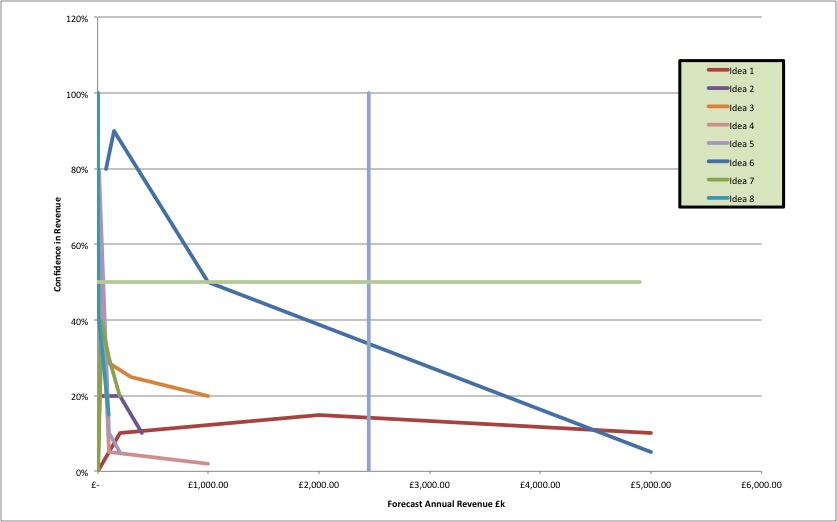
Horizontal axis – annual revenue forecast
I didn’t initially approach this in a mercenary way, but after trying a few variables, I found that using predicted revenue as the horizontal axis opened up a number of questions. While I wasn’t focussed on the money, it did make me evaluate how much effort I’d want to put into a venture in order to gain that revenue.
Vertical Axis – Confidence
For the vertical axis, I plotted my confidence in being able to achieve the revenue I’d stated. For the 3 or 4 revenue targets per business idea, I also evaluated my confidence in that target. Obviously, something being earned in the current year is 100%. And most ramped down towards the right as I my confidence decreased, the higher the revenue. The difference is that some business ideas had a steeper slope than others.
Analysis
Revenue Vs Confidence
I picked the most likely ideas I had at the time and plotted them on the chart. It was obvious that there were some with a good chance of high, recurring revenue, but that they bored me senseless. And unfortunately, the one I was most interested in, had a significant dependency on me and had no way of recruiting others to make it work. I chose to progress with one that interested me and had a decent chance of high revenue, with my consultancy as a backup.
Other variables
Since it was important to me to realise what was important to me, I had planned to use “passion” or “interest” for the vertical axis. However, when I did this, it was quickly evident to me how I felt about the idea in question. I didn’t need to have that value on a graph; I could feel it when I discussed the ideas.
For the horizontal access, I also considered:
- effort required to achieve that revenue
- familiarity with the domain in question
I also considered using the inverse of the effort required as a variable for the size of the data point, with easier ideas being bigger than more difficult ideas.
Further analysis
You’ll notice that in the Excel chart, I’ve also put the dividing lines for half of the max revenue and at 50% confidence so that we can start to see a four box model.
That leaves us with the first interpretation.
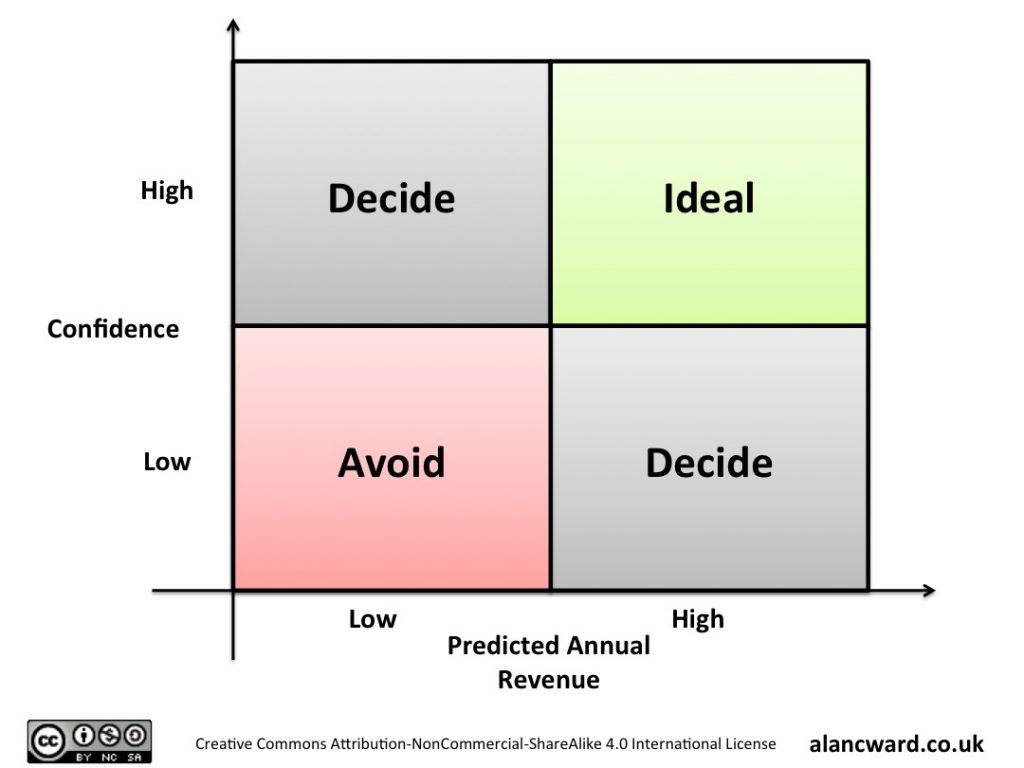
Revenue Vs Confidence 4 box model
The bottom left of low-confidence and low-revenue is easy to understand. It’s not the area to concentrate on.
The top right of high-confidence and high-revenue looks like the holy grail, but these usually require intense effort and significant funding and resources.
That leaves the top-left and bottom-right of high confidence, low revenue and low confidence and high revenue. The choice here is more on of lifestyle. What type of lifestyle are you after? Then choose the most appropriate box. This is where effort may have been a more useful axis than confidence.
Read Part 2 here.


One Response
[…] finished the previous part of this article with a four box model that had two quadrants with the same […]
Comments are closed.